A small model, a whole health system: what DT-Transformer gets right
DT-Transformer treats each patient's medical history as a token sequence and predicts the next diagnosis and its timing, trained on 57 million records from 1.7 million patients across an 11-hospital system. The result worth studying is not the architecture — it is the health-system-scale data and the honest prospective test.

A work in progress out of Mass General Brigham — DT-Transformer, by Yunying Zhu, Andrew Weckstein, Kueiyu Joshua Lin, and Jie Yang — does something that is easy to describe and hard to do well. It reads a patient's medical history as a sequence and predicts what comes next: the next diagnosis, chosen from hundreds of possibilities, and roughly when it will arrive. Not a bespoke risk score for a single condition. The whole trajectory, one event at a time.
I keep coming back to this framing, because the record was a sequence all along and most clinical models throw that structure away.
The record is already a sequence
An electronic health record is an ordered list of things that happened to a person over time. Line those diagnoses up by age and you have exactly the shape a language model expects: a sequence of tokens where the task is to predict the next one. DT-Transformer takes that literally. Each patient becomes a string of ICD disease categories, and training is next-event prediction — the same objective that trains a text model, pointed at medicine instead of prose.
The architecture is deliberately ordinary. Twelve transformer layers, twelve attention heads, an embedding dimension of 120 — about 2.2 million parameters. The vocabulary is 1,375 ICD categories plus a handful of tokens for sex, smoking and alcohol status, death, and "no event." The one genuinely medical design choice is time. Instead of encoding a token's position by its index in the sequence, the model uses a sinusoidal encoding of the patient's continuous age in days at each diagnosis. And it carries two output heads: one for the next-event distribution over disease and death tokens, and one for time-to-event, modeled as an exponential waiting time.

A small model, a whole health system
By 2026 standards, 2.2 million parameters is nothing. The scale here is not in the model — it is in the data. DT-Transformer is trained on 57.1 million structured EHR entries from 1.7 million patients, drawn from Mass General Brigham's eleven hospitals and its outpatient network, spanning 2000 to 2024.
That choice is the argument of the paper. Models trained on curated research cohorts learn a cleaned-up world that does not survive contact with routine care. Models trained on a single hospital see only the fragment of a patient's life that passed through that building. A patient who is born, diagnosed, treated, and followed across an integrated system leaves a far more complete record — and completeness is what a trajectory model needs. Health-system scale is not a bigger benchmark; it is a more honest one.
The number that matters is the prospective one
On held-out patients, DT-Transformer reports a median age- and sex-stratified AUC of 0.871 across 896 disease categories, with every category above 0.5 and 96% of them beating a demographic baseline built from age- and sex-stratified incidence. Those are strong numbers. They are also the easy numbers.
The number I trust is the prospective one. The authors took every patient alive at the end of 2022, used only their history through that date, and asked the model to predict first-occurrence diagnoses in 2024 — a genuine forward test against events the model could not have seen. There, the median AUC is 0.713 across 898 diseases, still ahead of the baseline in 80% of them, with predicted annual incidence tracking observed incidence across several orders of magnitude.
The gap between 0.871 and 0.713 is the discipline of production machine learning compressed into two numbers. Held-out performance tells you how well you fit the past. Prospective performance tells you what to expect at deployment. Reporting both — and leading with the harder one — is the part I want more medical-AI papers to copy.
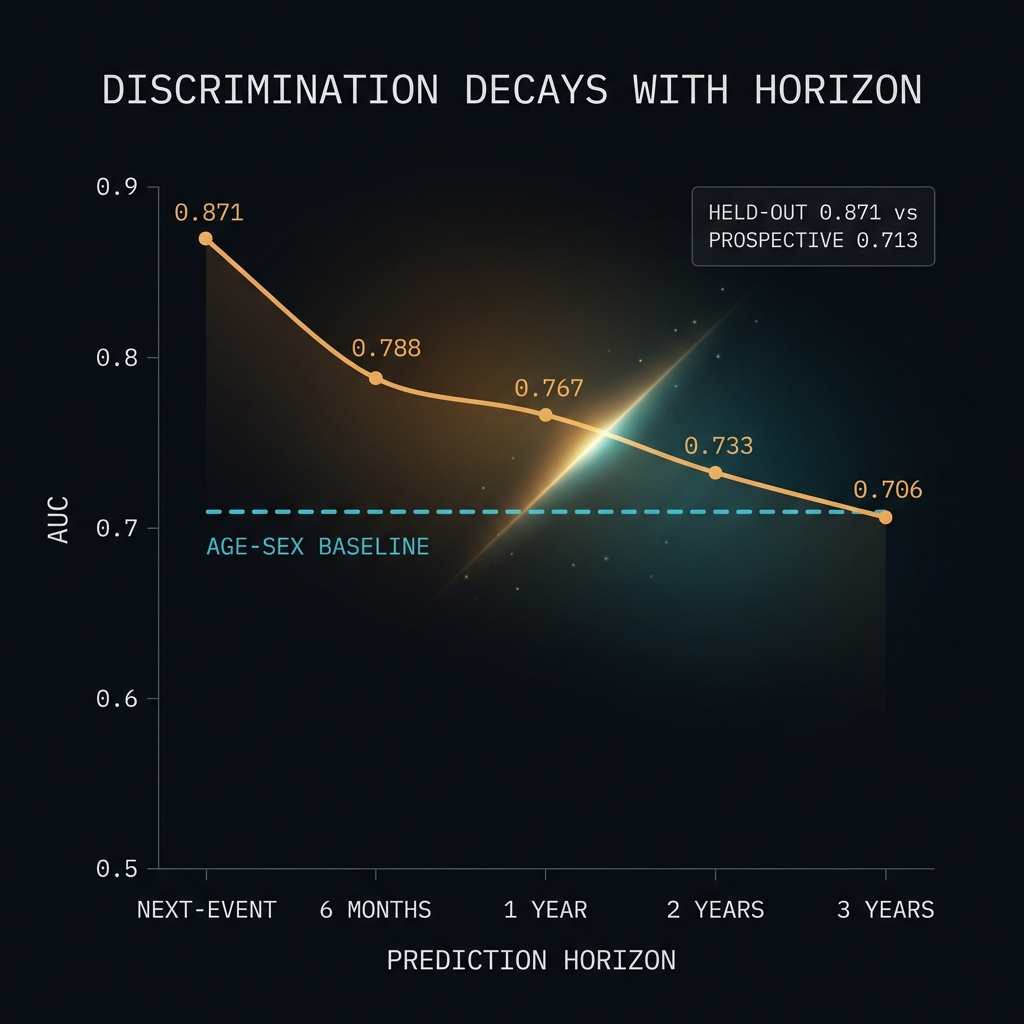
Discrimination decays with horizon
The model is sharpest close to the present and softens as the horizon extends. Median AUC falls from 0.871 for the next event to 0.788 at six months, 0.767 at one year, 0.733 at two years, and 0.706 at three. Its lift over the demographic baseline shrinks in step — from +0.214 at the next event to +0.056 at three years.
The likely reason is the completeness argument turned around. Any care a patient receives outside the MGB network is invisible to the model. Over a few months that matters little. Over three years, a patient diagnosed elsewhere looks event-free in the data, and long-horizon labels quietly degrade. The curve is not only a property of the model; it is a property of what the health system can and cannot observe.
What I would carry into production
A few things stay with me. The model is the easy part — a small transformer trained with a fixed configuration and no elaborate tuning. The hard, valuable work is the data completeness and the evaluation honesty. The paper also reports that modeling first occurrences beat an all-occurrence variant that re-emitted recurring diagnoses, a reminder that how you define the prediction target moves results as much as any architecture change.
Two cautions belong next to the headline. Performance was consistently higher for female patients than male across every horizon — a disparity I would want understood, not averaged away, before anyone acted on a prediction. And the authors are direct about their limits: out-of-network events go unobserved, the age-based time encoding may not be ideal, and none of this has been tuned hard. That candor is why the work reads as a foundation to build on rather than a leaderboard entry. A 2.2-million-parameter model, pointed at a whole health system and tested against its own future, is a better template for clinical forecasting than a larger model tested against its own past.